Our starting point was figuring out what to do with large, multidimensional data sets. If you're given a bunch of data, how do you start to figure out what might be interesting? A natural approach is to calculate some measure on each pair of variables which serves as a proxy for how interesting they are -- where interesting, to us, means that the variables appear dependent in some way. Once you have this, you can pull out the top-scoring pairs and take a closer look.
What properties would we like our measure to have?
First, we would like it to be general, in the sense that it should pick up as diverse a collection of possible associations between variables as possible. The well-known Pearson correlation coefficient, for example, does not have this property -- as you can see from this Wikipedia picture
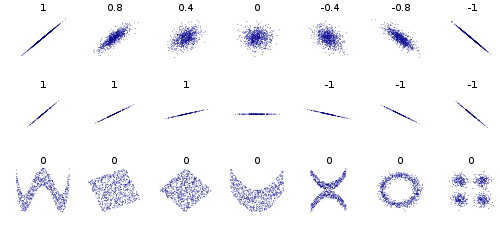
it's great at picking up linear relationships, but other relationships (periodic sine waves, parabolas, exponential functions, circular associations) it's not so good at.
Second, we would like it to be what we call equitable. By this we mean that scores should degrade with noise at (roughly) the same rate. If you start with a line and start with a sine wave, and add an equivalent amount of noise to both of them in the same way, the resulting scores should be about the same; otherwise the method would give preference to some types of relationships over others.
I should point out that the goal behind these properties is to allow exploration -- the point is you don't know what sort of patterns in the data you should be looking for. If you do know, you're probably better off using a specific tests. If you're looking for linear relationships, Pearson is great -- and there are a large variety of powerful tests that have been developed for specific types of relationships over the years.
Our suggested measure, MIC (maximal information coefficient), is based on mutual information, but is different from it. Our intuition is that if a relationship exists between two variables, then a grid can be drawn on the scatterplot that partitions the data in a way that corresponds to that relationship. Suppose we have a grid, with x rows and y columns; then this grid induces a probability distribution, where the probability associated with a box on the grid is proportional to the number of data points it contains. Let I_G be the mutual information of the grid. We aim to maximize I_G/ log min(x,y) -- this is the MIC score. (We bound x, y values to avoid trivial cases like every point having its own box; see the paper for more details.) MIC values are between 0 and 1, and we can approximately compute MIC values heuristically. Our work shows via a mix of proofs and experiments that MIC appears to have the properties of generality and equitability we desire.
Based on the approach we use to find MIC, we suggest several other possible useful measures, and we refer to the collection as MINE (maximal information-based nonparametric exploration) statistics. For example, MIC - Pearson^2 turns out to be a useful measure for specifically finding nonlinear relationships. When MIC is high (close to 1) and Pearson is low (close to 0), there is a relationship that MIC has found but it is not a linear one; for linear patterns, both MIC and Pearson are high, and so this measure is close to 0. Other measures we have measure things like deviations from monotonicity -- useful for finding periodic relationships.
Should MIC/MINE prove useful, I believe there's lots of theoretical questions left to consider. The approach is currently essentially heuristic, although we do prove a fair number of things about it. Proving more about its properties would be useful, as well as improving the complexity to compute the relevant measures.
Next up: more about the experience of working on this project.
4 comments:
Thanks for this description. The main application of MIC as you describe it (and what seems to be the MINE approach described in the paper), is to take a high dimensional dataset and correlate all pairs of variables, and then select the top hits.
Does this run into the multiple samples comparison problem? That is, as the number of pairwise comparisons N increases, I'd expect the frequency of high MIC scores (close to high correlation or high anticorrelation) to also increase. Curious if you had any thoughts on this. --YK
Anon: We discuss this in the paper. It's a standard issue for these sorts of problems. There's a whole subfield of statistics devoted to this issue; see http://en.wikipedia.org/wiki/Multiple_testing for details.
Thanks for a good post and a chance to discuss your article. To me, MIC and MINE seem great exploration tools but I'm a bit puzzled about the magic parameter B, limiting the complexity of the overlaid grid.
As is evident from Figure S1 in the supplement, MIC tends to 1 as B tends to size of your data. Isn't this due to overfitting the histogram to the data? Why don't you use something like MDL to control complexity of your irregular 2D histogram (e.g. by adapting "MDL Histogram Density Estimation" by Kontkanen and Myllymaki. See Kontkanens thesis for analytical approximation.)
In my view, because of the overfitting, MINE is much more important contribution than MIC. That being said, they are likely to become the tool of choice when Pearson fails.
Multiple testing is really not that simple and conceptually tricky. It is not a solved problem in statistics.
Post a Comment